Data Science #
- Churn Management
version du 25-12-2018
Gestion de l’attrition ou Churn management #
Le churn est un anglicisme qui désigne la perte des clients. La gestion du churn figure parmi les piliers les plus importants à tenir en compte lors de la gestion de fidélisation, car l’acquisition à elle seule ne peut pallier aux pertes de la clientèle. (voir illustration)
Étudier le churn pousse à réfléchir parallèlement à plusieurs actions pouvant contribuer à sa réduction et à la maximisation de la valeur de la relation client:
- Churn Problem Framing
Churn - Problem Framing #
Churn reporting #
What happened? (Inactive point of view)
- In general cohorts work good here: start with a small population of churners and follow them over time
- Clustering churners based on project and modeling bottom line
- Example of small population of churners => “Churners who generate more profits, churns who explicitly expressed their insatisfaction”: or choose another prioritization criterion
- Monetary retention rates (monetary churn)
- Reversed cohorts: start with the churn date (Month / Year) and follow the churners retrospectively
- Product / offers / segments cohorts
- Maybe change of nomenclature/perspective to make problem framing more accessible to other shareholders (Product Churn, Account Churn, Usage Churn…etc)
Why did it happen?
- Feature Store
version 19-08-2024
Feature Store as a System #
- follows a logical flow
- seperates concerns functionally
- builds modular-ily

Pipeline and code break-down #
Data Selection and UC-specific processing #
We start by filtering a reference table based on specific conditions aligned with the requirements of the use case. This creates a use case table on which we select and process pivot columns.
Note: This should happen in the processing and modeling modules.
Pivot transformations and Data federation #
We select specific columns in order to create transitional tables with the desired pivot columns.
- Outlier Detection
Types of outliers #
With regards to the distribution #
- Univariate: can be found when looking at a distribution of values in a single feature space.
- Multivariate: can be found in a n-dimensional space (of n-features).
With regards to the environment #
- Point outliers: single data points that lay far from the rest of the distribution.
- Contextual outliers: can be noise in data, such as punctuation symbols when realizing text analysis or background noise signal when doing speech recognition.
- Collective outliers: Collective outliers can be subsets of novelties in data such as a signal that may indicate the discovery of new phenomena.
Most common causes of outliers on a data set #
- Data entry errors (human errors)
- Measurement errors (instrument errors)
- Experimental errors (data extraction or experiment planning/executing errors)
- Intentional (dummy outliers made to test detection methods)
- Data processing errors (data manipulation or data set unintended mutations)
- Sampling errors (extracting or mixing data from wrong or various sources)
- Natural (not an error, novelties in data)
Hint
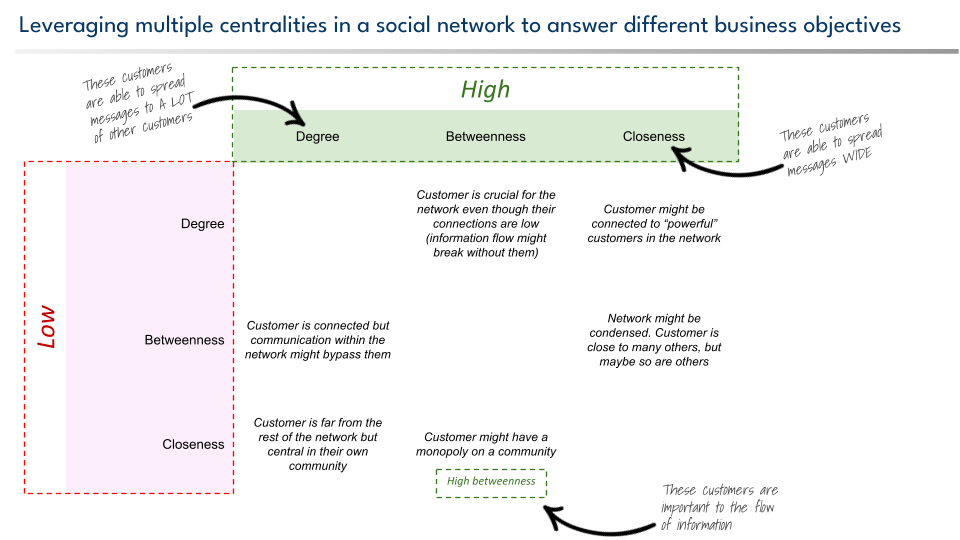
- SNA